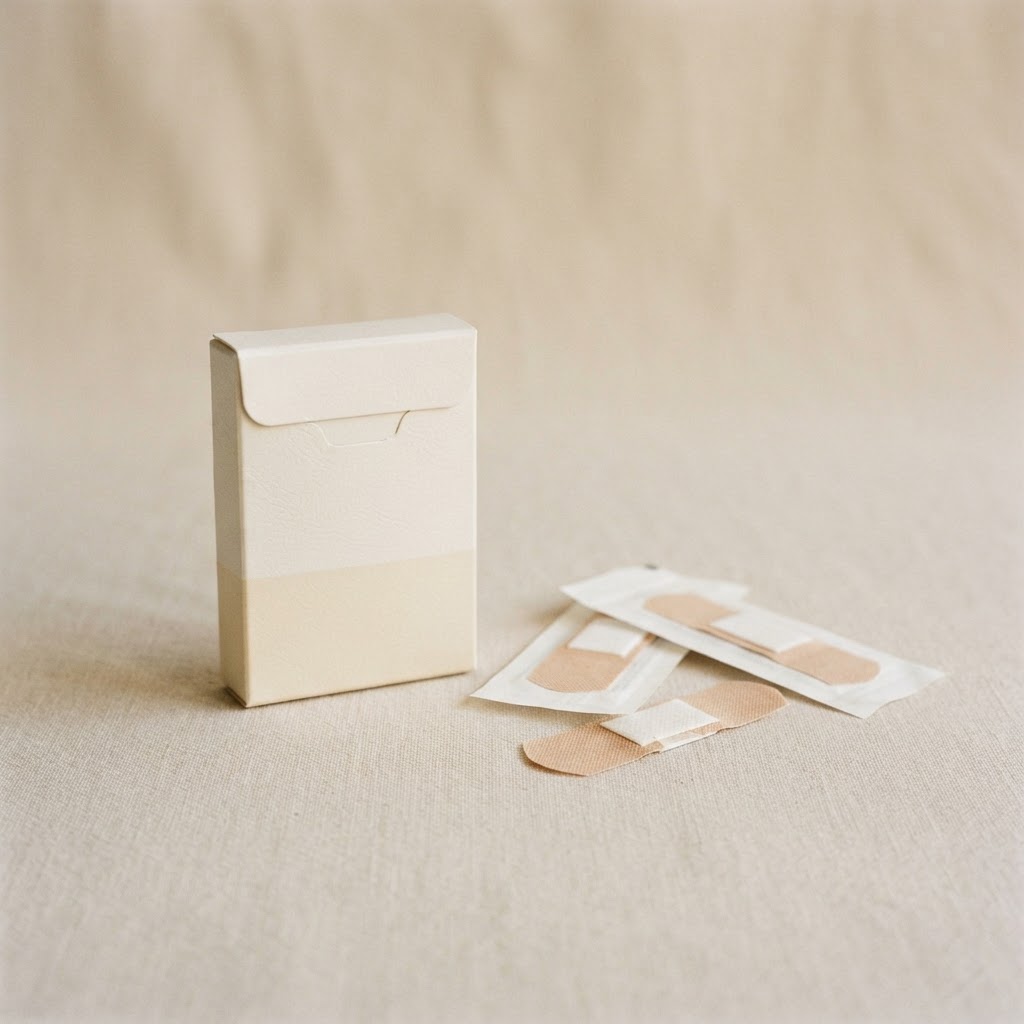
Pflasterbox
40 Gewebepflaster
Jedes Pflaster steckt in einer laminierten Folie, die Verpackung wiegt damit mehr als der Wundverband selbst.
Materialaufschlüsselung
3 Komponenten- Einzelverpackungen20g
- Trägerfolie und Wundkissen14g
- Sichtfenster der Box2g
Herstellungs-Fußabdruck
Pro EinheitGeschätzter vorgelagerter Herstellungs-Fußabdruck pro Einheit, basierend auf durchschnittlichen Ökobilanzen für Kunststoffe.
Umweltfreundlichere Alternativen
- Kompostierbare Pflaster aus BambusfaserPapierhülle und pflanzlicher Träger.8gPlastik
- Pflasterrolle und MullbindeNur abschneiden, was gebraucht wird.6gPlastik
- Pflaster lose in der DoseEine Dose, keine Einzelverpackungen.12gPlastik
Weitere Alternativen vorschlagen
Erhalten Sie 3 plastikärmere Optionen, in Echtzeit recherchiert.
Tippen Sie auf „Vorschlagen“, um frische Ideen von unserer KI-Recherche zu erhalten.
Quellen zu diesem Produkt
Begutachtete Studien und Berichte von Institutionen hinter den obigen Zahlen.
- Degradation Rates of Plastics in the Environment ↗Chamas, A., Moon, H., Zheng, J., Qiu, Y., Tabassum, T., Jang, J. H., Abu-Omar, M., Scott, S. L. & Suh, S. (2020) · ACS Sustainable Chemistry & Engineering, 8(9), 3494–3511
Open-access review that harmonises plastic degradation studies into a specific surface degradation rate, giving half-lives from 58 years for an HDPE bottle to 1,200 years for thick HDPE pipe. Peer-reviewed basis for how our decomposition windows scale with wall thickness and format.
- Ranking environmental degradation trends of plastic marine debris based on physical properties and molecular structure ↗Min, K., Cuiffi, J. D. & Mathers, R. T. (2020) · Nature Communications, 11, 727
Ranks PE, PP, PET, PS, PVC and nylon by measured degradation susceptibility and shows that thickness, crystallinity and additives shift estimated lifetimes by one to two orders of magnitude. Backs our practice of scaling persistence by format rather than by polymer alone.
- Monitoring polymer degradation under different conditions in the marine environment ↗Beltrán-Sanahuja, A., Casado-Coy, N., Simó-Cabrera, L. & Sanz-Lázaro, C. (2020) · Environmental Pollution, 259, 113836
Field study exposing PET, LDPE, HDPE, PP and PS in seawater, sediment and beach sand for nine months; conventional polymers lost under a few percent of their mass. Direct measured evidence for the very slow marine degradation behind our long persistence windows.
- Alteration and progressive degradation of plastic waste in a Polish operational landfill analysed over 60 years ↗Redko, V., Wolska, L., Cieślak-Piotrowicz, A. et al. (2024) · Communications Earth & Environment, 5, 563
Excavated polyethylene bags and film buried for up to six decades in a working landfill and found only partial surface oxidation, not disappearance. Real-world confirmation that landfilled film persists far beyond the lifetimes often quoted.