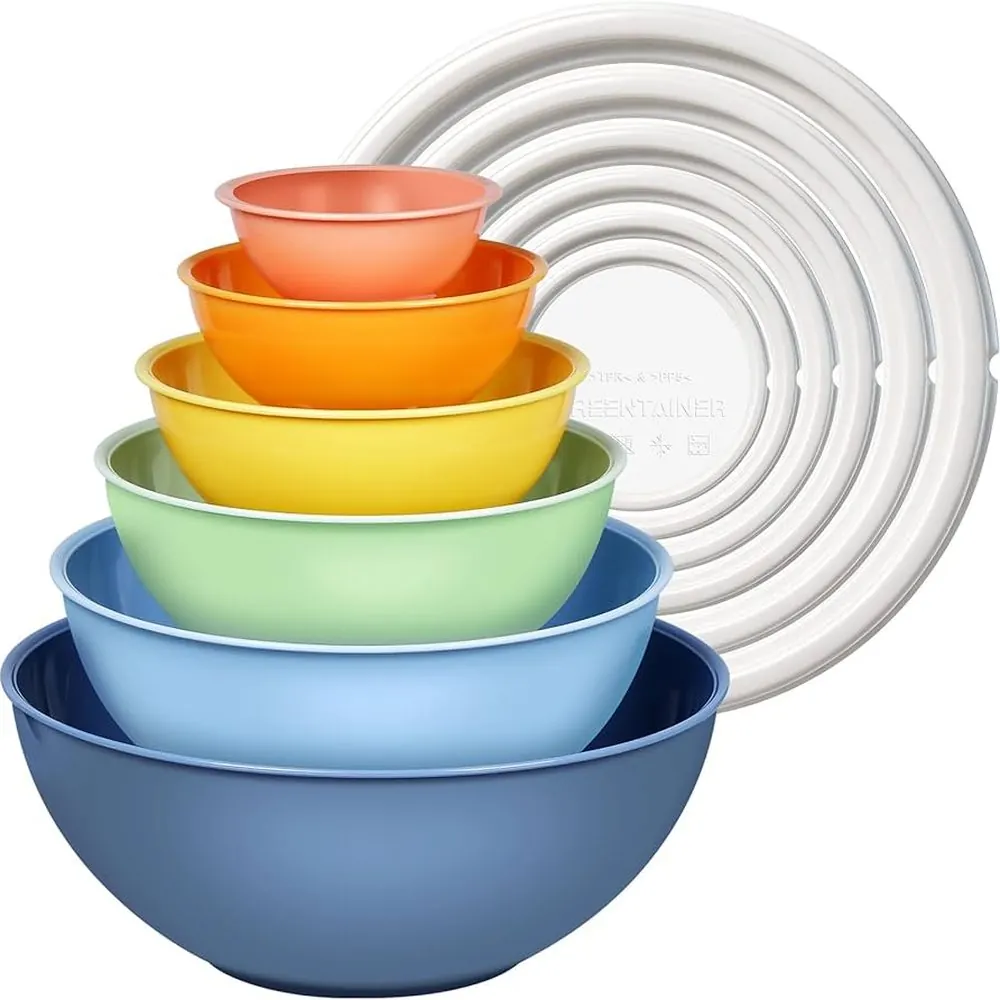
Microwave Plastic Bowl
750ml bowl
Mono-PP is one of the easier formats to recycle, when it gets to the bin.
Material breakdown
2 components- PP body30g
- PP lid8g
Production footprint
Per unitEstimated upstream manufacturing footprint per unit, based on resin LCA averages.
Lower-impact alternatives
- Borosilicate glass bowl with silicone lidIndefinitely reusable, 100% plastic-free materials.0gplastic
- Pressed sugarcane pulp bowlCompostable plant-based fiber with zero plastic content.0gplastic
- Stainless steel microwave-safe containerExtremely durable, only small silicone seal contains polymer.2.5gplastic
Suggest more alternatives
Get 3 lower-plastic options researched in real time.
Tap suggest to fetch fresh ideas from our AI researcher.
References for this item
Peer-reviewed studies and institutional reports behind the figures above.
- Degradation Rates of Plastics in the Environment ↗Chamas, A., Moon, H., Zheng, J., Qiu, Y., Tabassum, T., Jang, J. H., Abu-Omar, M., Scott, S. L. & Suh, S. (2020) · ACS Sustainable Chemistry & Engineering, 8(9), 3494–3511
Open-access review that harmonises plastic degradation studies into a specific surface degradation rate, giving half-lives from 58 years for an HDPE bottle to 1,200 years for thick HDPE pipe. Peer-reviewed basis for how our decomposition windows scale with wall thickness and format.
- We need better data about the environmental persistence of plastic goods ↗Ward, C. P. & Reddy, C. M. (2020) · Proceedings of the National Academy of Sciences, 117(26), 14618–14621
Shows that popular persistence figures, including the widely repeated 450 years for a plastic bottle, cannot be traced to any measurement. This is why we give persistence as a range grounded in measured degradation rates instead of a single headline number.
- Ranking environmental degradation trends of plastic marine debris based on physical properties and molecular structure ↗Min, K., Cuiffi, J. D. & Mathers, R. T. (2020) · Nature Communications, 11, 727
Ranks PE, PP, PET, PS, PVC and nylon by measured degradation susceptibility and shows that thickness, crystallinity and additives shift estimated lifetimes by one to two orders of magnitude. Backs our practice of scaling persistence by format rather than by polymer alone.
- Pathways for degradation of plastic polymers floating in the marine environment ↗Gewert, B., Plassmann, M. M. & MacLeod, M. (2015) · Environmental Science: Processes & Impacts, 17(9), 1513–1521
Open-access review of the chemical routes by which PE, PP, PET, PS and PVC break down at sea, showing that carbon-backbone polymers such as PE and PP resist hydrolysis and depend on slow photo-oxidation. Explains why our persistence windows differ by polymer as well as by format.
- Monitoring polymer degradation under different conditions in the marine environment ↗Beltrán-Sanahuja, A., Casado-Coy, N., Simó-Cabrera, L. & Sanz-Lázaro, C. (2020) · Environmental Pollution, 259, 113836
Field study exposing PET, LDPE, HDPE, PP and PS in seawater, sediment and beach sand for nine months; conventional polymers lost under a few percent of their mass. Direct measured evidence for the very slow marine degradation behind our long persistence windows.
- Alteration and progressive degradation of plastic waste in a Polish operational landfill analysed over 60 years ↗Redko, V., Wolska, L., Cieślak-Piotrowicz, A. et al. (2024) · Communications Earth & Environment, 5, 563
Excavated polyethylene bags and film buried for up to six decades in a working landfill and found only partial surface oxidation, not disappearance. Real-world confirmation that landfilled film persists far beyond the lifetimes often quoted.